


Your business creates a lot of data every day. This data comes from sales, marketing, and customer service. Without a clear view, you are just guessing. A customer insight dashboard is the tool that changes this. It turns your raw data into a clear map for making smarter decisions.
Introduction
We are all swimming in a sea of data. This section explains why a dashboard is your best lifeguard.
The Data Deluge: Why Businesses Drown Without Direction
Businesses today collect huge amounts of customer data. Every click, purchase, and support ticket adds to the pile. The problem is not a lack of data. It is a lack of understanding. Trying to find a clear pattern in messy spreadsheets is almost impossible. You get buried in numbers without finding any real answers. This is data overload. It stops you from moving forward.
The North Star: How Customer Insight Dashboards Light the Way
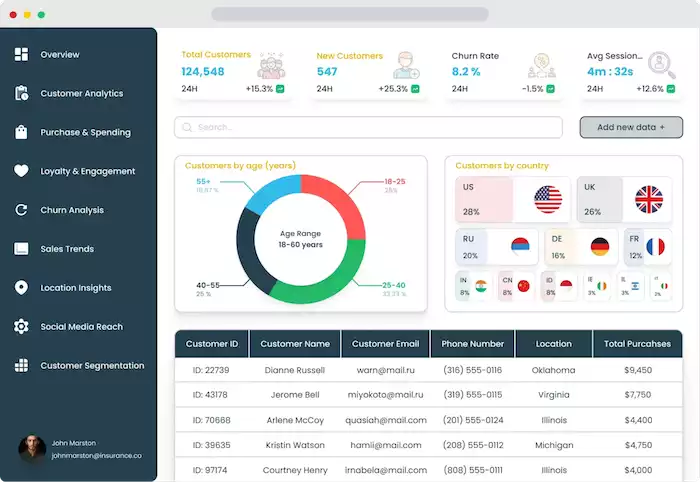
A customer insight dashboard is your command center. It’s a visual tool that brings all your key customer data into one place. Its strength lies in simplicity, transforming complex numbers into clear, easy-to-read charts and insights.
This clear view helps you stop guessing and start knowing. You can finally make decisions based on real evidence, not just a gut feeling.
Why Dashboards Matter: The Strategic Value of Insights
A dashboard is more than just pretty charts. It is a smart tool that drives real business growth.
Beyond Metrics: Turning Data into Actionable Insights
Raw data is just a collection of facts, like "100 website visits." A metric is a measurement, like "a 5% bounce rate." Neither one tells you what to do. An actionable insight is different. It is the "why" behind the numbers. For example: "Our bounce rate is high because the mobile checkout page loads too slowly." A dashboard helps you connect these dots. It shows you metrics in context. This helps you spot the "why" and find the "what to do next."
Key Benefits for Your Business
When you understand your customers, everything gets better. You can see which customer groups are most profitable. Then you can find more people like them. This deep understanding lets you give them a personal experience. You can create marketing messages that people connect with. Your sales team can focus on the best leads.
Common Use Cases Across Industries
Dashboards are not just for one type of business. E-commerce stores use them to track why shoppers leave carts. SaaS companies watch how users engage with their software. This helps more people use new features. Retail stores compare sales data with store traffic. Service businesses track customer feedback scores to improve their support.
Building Your Command Center: Key Dashboard Components
Building a useful dashboard takes some planning. You need to know what to put in it and why.
Defining Your Purpose: What Questions Do You Need Answered?
Do not just start adding metrics. First, ask yourself some hard questions. What are your main business goals right now? Are you trying to find more customers? Or are you focused on keeping the ones you have? Your dashboard should answer your most important questions.
Set clear goals, or KPIs (Key Performance Indicators). These goals should match your main business goals. A dashboard built to increase sales looks very different. It is not like one built to improve customer support.
Data Sources: Where Does Your Customer Information Live?
Your customer data is probably spread out. It lives in your CRM like Salesforce or HubSpot. It is in your website reports from Google Analytics… A good dashboard must connect these sources. It needs to pull all this information together. This creates one clear view of your customer.
Essential Metrics to Track
While your goals will guide your choices, most dashboards track a few key areas.
For acquisition, you measure Customer Acquisition Cost (CAC). This shows how much it costs to get a new customer. For engagement, you look at website visits. Or you see how often people use a software feature. For retention, you track your churn rate (how many customers you lose). You also track Customer Lifetime Value (CLTV). For satisfaction, you use scores like Net Promoter Score (NPS) or Customer Satisfaction (CSAT). Finally, revenue metrics like Average Order Value (AOV) show you how much customers spend.
Visualization Best Practices: Making Data Easy to Read
How you show your data matters. You must choose the right chart for the job. Use bar charts for comparisons. Use line charts to show trends over time. Pie charts are good for simple percentages. Keep the design clean and simple. Use color to show important information, not just for looks. Good dashboards often let you click on things. This lets you click on a number to see more details.
Tools of the Trade: Popular Dashboard Platforms
You have many options for building your dashboard. Big Business Intelligence (BI) tools like Tableau or Power BI are very powerful. Some CRMs have their own built-in dashboards. There are also marketing-specific platforms. Some businesses even build their own custom solutions.
Platforms like Botcake act as both a data source and an insight tool. In conversational commerce, combining Botcake with your CRM gives you a full picture of how customers interact with your brand, how often they chat with you, what they’re looking for, their purchase intent, and even the value they convert through messaging. All of this can be synced into a CRM like Pancake, where you can build a complete Customer 360 profile for smarter marketing and better decision-making.
From Insights to Impact: Using Your Dashboard for Growth

A beautiful dashboard that no one uses is a waste of time. The real value comes from using it to make changes.
Regular Review and Analysis: Don't Let it Gather Dust!
You must make this dashboard part of your routine. Set up a regular schedule to review it. Your marketing team might check it daily. Your leadership team might review it weekly or monthly.
Identifying Trends and Anomalies: Spotting Opportunities and Risks
As you review your dashboard, you will start to see patterns. You might notice that sales always dip on a certain day of the week. Or you might see a sudden spike in bad support tickets. This is something different or unexpected. These patterns and breaks are your clues. Something unexpected might be a risk, like a broken website link. A trend might be an opportunity. For example, a marketing channel suddenly does very well.
Hypothesis Testing and Experimentation
Your insights should lead to new ideas. When you see a pattern, you make a smart guess. For example: "We see that few people click our 'buy' button. Our guess is that changing the button color to red will get more clicks." A/B testing is how you check this. You show half your audience the old button. You show the other half the new one. The dashboard then tracks the results. This is how you use data to test and improve your business.
Driving Actionable Strategies: Putting Insights to Work
Your insights should directly change your strategy. You may learn that customers from one area love a product. You can then create a special marketing campaign just for them.
Communicating Insights Effectively: Storytelling with Data
You cannot be the only one who understands the data. You need to share your findings with your team and leaders. Do not just show them a spreadsheet. Tell them a story. Start with the key takeaway. Explain the pattern you found. Then, give your recommendation. Focus on what the data means for the business.
Advanced Strategies and Future Trends
A basic dashboard is a great start. But the future of insights is even more powerful and automated.
Predictive Analytics and AI Integration
The next level is predictive analytics. This is when your dashboard looks at the future, not just the past. AI models can analyze your data. They can guess what customers will do next. They can find which customers are at high risk of leaving. This lets you step in and save them before they leave. AI can also help automate the insight process. It can point out patterns you might have missed.
Real-time vs. Batch Processing: Choosing the Right Approach
Some data can be updated once a day. This is called batch processing. It is fine for long-term strategic reports. But sometimes you need data now. A customer support team needs a real-time dashboard. They need to see a spike in support tickets the moment it happens. E-commerce stores need real-time sales data during a big promotion. You must choose the right approach for the right problem.
Personalization and Customization
One dashboard cannot serve everyone. Your CEO needs a high-level view of the whole business. Your social media manager needs to see all the details. They need to see campaign performance. A good dashboard platform lets you personalize. You can create different views for different roles. This helps everyone on your team. They can explore data on their own.
Ethical Considerations and Data Privacy
With great power comes great responsibility. You must be ethical in how you collect and use customer data. Be open and honest with your customers. Always follow privacy rules like GDPR. Building trust is essential. Customers will only share their data. They must believe you will protect it. They must trust you to use it responsibly.
Common Challenges and How to Overcome Them

Building a dashboard is not always easy. You will likely hit a few common roadblocks along the way.
Data Silos: Breaking Down Barriers
The most common problem is the data silo. This is when your sales data and marketing data are separate. These systems do not talk to each other. You cannot get a full view of the customer this way. The solution is to create a single plan for your data. You need tools and methods to connect these different data sources.
Data Quality Issues: Garbage In, Garbage Out
Your insights are only as good as your data. Your data might be full of errors or duplicates. You must have a way to clean and check your data. Make sure data is correct and the same across all your systems.
Overwhelm and Analysis Paralysis
Sometimes the dashboard is too good. It has hundreds of metrics. This leads to analysis paralysis. The fix is to focus on simplicity. Your dashboard should show the few key metrics that truly matter. You can always add more later. Start simple and build on it over time.
Lack of Actionable Insights
This is a frustrating problem. You have a dashboard, but it does not tell you anything useful. This usually happens when the dashboard is not connected to real business questions. You must encourage your team to ask "why." You must also encourage them to connect the data back to their daily work.
Conclusion
Your data holds the key to your business's future. A customer insight dashboard is the tool that unlocks it. Start by asking what questions you need to answer. Identify your data sources. Begin tracking the metrics that matter. And if you use chat to talk to your customers, platforms like Botcake are an essential source of real-time insights. Start today, and you can build a smarter business tomorrow.